Image Details
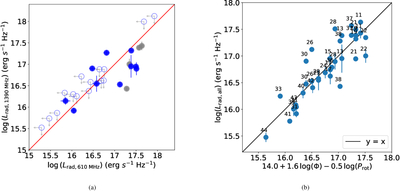
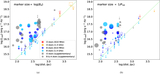
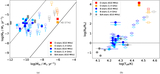
Caption: Figure 8.
Inclusion of 1390 MHz bands. (a) Comparison of radio luminosities obtained from the 610 and 1390 MHz bands. The red line represents the x = y line. Filled symbols represent detections (at both bands), while open circles represent nondetections (again, at both bands). Blue symbols represent the core sample, and the gray symbols represent supplementary samples. (b) Two-variable regression of magnetic flux (Φ) and rotation period vs. radio luminosity.
Other Images in This Article
Show More
Copyright and Terms & Conditions
© 2026. The Author(s). Published by the American Astronomical Society.
Copyright ©
2026 Astronomy Image Explorer. All Rights Reserved.