Image Details
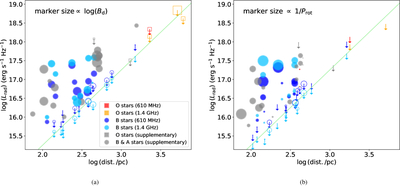
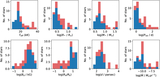
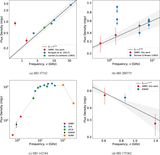
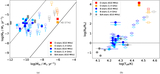
Caption: Figure 4.
Radio luminosity vs. distance of the stars: (a) symbol size proportional to dipolar magnetic field strength (Bd), and (b) symbol size proportional to rotational frequency (frot). The filled squares and circles denote detections of O and B stars, respectively, while open symbols denote nondetections. The dark-blue and light-blue circles represent data from 610 and 1390 MHz observations of B stars from this project, respectively. Similarly, red and orange squares represent O stars observed at 610 and 1390 MHz, respectively. The gray squares and circles represent additional O and B (or A) stars observed with GMRT/uGMRT, which are taken from P. Chandra et al. (2015) and B. Das et al. (2022b). The solid green lines in both panels indicate the 3σ detection limit assuming an image noise level of 50 μJy.
Other Images in This Article
Show More
Copyright and Terms & Conditions
© 2026. The Author(s). Published by the American Astronomical Society.