Image Details
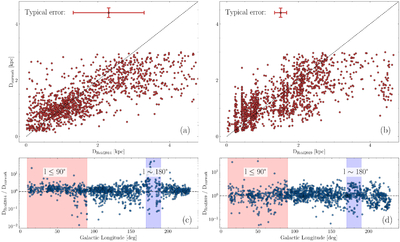
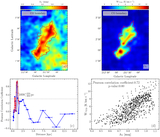
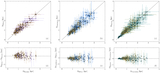
Caption: Figure 11.
Comparison with kinematic distances derived from the A5 model in M. J. Reid et al. (2014) and its improved version from M. J. Reid et al. (2019). In panels (a) and (b), typical errors for the two datasets are indicated in the upper-left corners: 0.171 kpc (this work) and 0.99 kpc (M. J. Reid et al. 2014) in panel (a), and 0.164 kpc (this work) and 0.170 kpc (M. J. Reid et al. 2019) in panel (b). Panels (c) and (d) plot DReid/Dthiswork versus Galactic longitude for the M. J. Reid et al. (2014) and M. J. Reid et al. (2019) datasets, respectively. The red and blue shaded regions indicate the longitude ranges l ≤ 90° and l ∼ 180°, respectively. The horizontal dashed line marks DReid/Dthiswork = 1.
Other Images in This Article
Show More
Copyright and Terms & Conditions
© 2026. The Author(s). Published by the American Astronomical Society.