Image Details
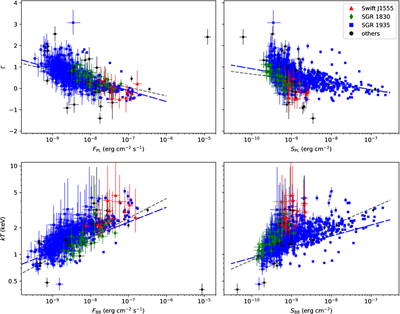
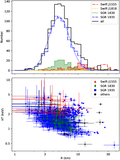
Caption: Figure 9.
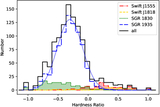
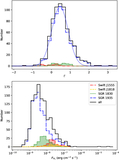
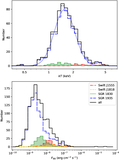
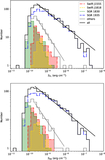
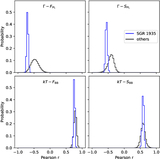
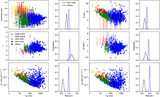
Distribution of spectral parameters. Different data points represent magnetar groups as defined in Figure 7 and indicated in the legend. The blue long-dashed lines and the gray dashed lines show the best-fit power-law relations for SGR 1935+2154 and for all other magnetars, respectively.
Other Images in This Article
Copyright and Terms & Conditions
© 2026. The Author(s). Published by the American Astronomical Society.
Copyright ©
2026 Astronomy Image Explorer. All Rights Reserved.