Image Details
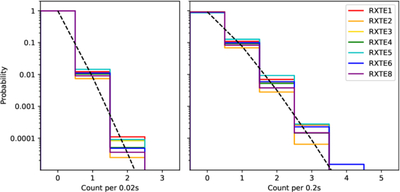
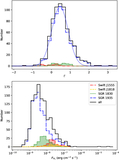
Caption: Figure 1.
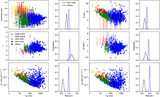
Distributions of background counts calculated with 0.02 s (left) and 0.2 s (right) time bins. Different colors correspond to the RXTE blank-sky regions identified in the legend. Black dashed lines are the Poisson probability mass function of averaged background counts calculated from Table 2.
Other Images in This Article
Copyright and Terms & Conditions
© 2026. The Author(s). Published by the American Astronomical Society.
Copyright ©
2026 Astronomy Image Explorer. All Rights Reserved.