Image Details
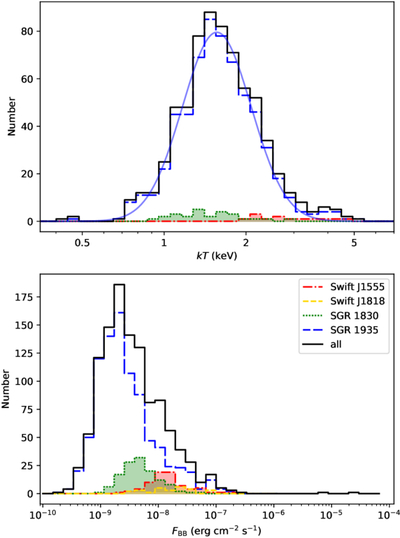
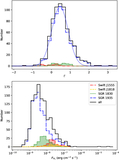
Caption: Figure 6.
Blackbody temperature kT (top) and flux FBB (bottom) distributions of all bursts. Different histograms represent magnetar groups as defined in Figure 2 and indicated in the legend. For the kT distribution, most Swift J1818.0−1607 bursts have fewer than 20 counts, and their kT values were fixed during spectral fitting; therefore, this sample is not plotted separately on the top panel.
Other Images in This Article
Copyright and Terms & Conditions
© 2026. The Author(s). Published by the American Astronomical Society.
Copyright ©
2026 Astronomy Image Explorer. All Rights Reserved.