Image Details
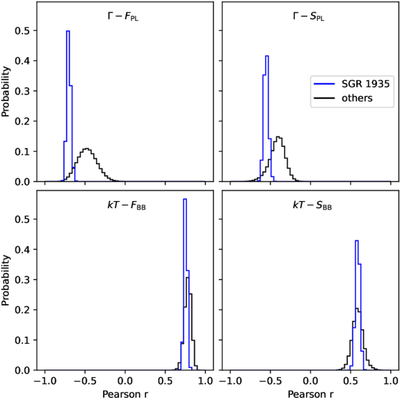
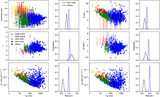
Caption: Figure 10.
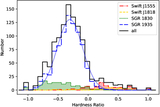
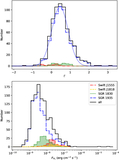
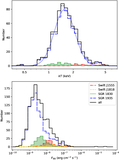
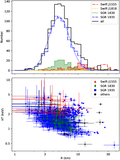
Distributions of Pearson correlation coefficients between spectral parameters obtained using the bootstrap method. The parameter combinations are indicated at the top of each panel. The blue and the black histograms represent the SGR 1935+2154 sample and all other magnetar samples, respectively.
Other Images in This Article
Copyright and Terms & Conditions
© 2026. The Author(s). Published by the American Astronomical Society.
Copyright ©
2026 Astronomy Image Explorer. All Rights Reserved.