Image Details
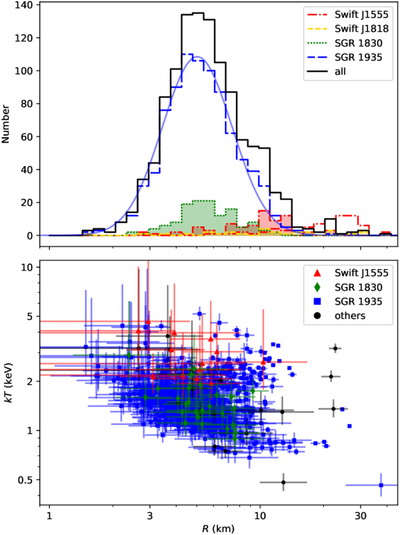
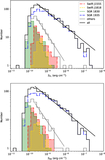
Caption: Figure 7.
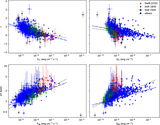
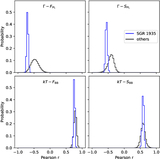
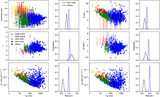
Distribution of blackbody emission radius R (top) and emission radius R versus temperature kT (bottom). Different histograms represent the magnetar groups defined in Figure 2, as indicated in the legend. The unshaded red histogram shows Swift J1555.2−5402 assuming a distance of 10 kpc, while the shaded red histogram assumes a distance of 4.5 kpc. The blue curve shows the log-normal fit to the R distribution of the SGR 1935+2154 sample. In the bottom panel, red triangles represent Swift J1555.2−5402, green diamonds represent SGR 1830−0645, blue squares represent SGR 1935+2154, and black circles represent the remaining magnetars.
Other Images in This Article
Copyright and Terms & Conditions
© 2026. The Author(s). Published by the American Astronomical Society.