Image Details
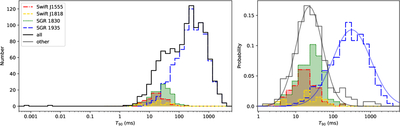
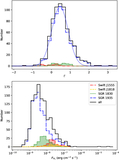
Caption: Figure 2.
The left panel shows the overall duration distribution of the NICER magnetar bursts, and the right panel focuses on bursts with durations longer than 1 ms. In the right panel, the sample is divided into two groups: SGR 1935+2154 and all other magnetars, with each distribution normalized by its respective sample size so that their histogram sums to 1. The red dashed–dotted line represents Swift J1555.2−5402 (Swift J1555), the yellow dashed line represents Swift J1818.0−1607 (Swift J1818), and the green dotted line represents SGR 1830−0645 (SGR 1830). The histograms of these three samples are filled for clarity. The blue long-dashed line corresponds to SGR 1935+2154 (SGR 1935), and the black solid histogram represents all bursts. The gray histogram shows all samples except SGR 1935+2154. The blue and the gray curves indicate the log-normal fits to the normalized SGR 1935+2154 and other samples, respectively.
Other Images in This Article
Copyright and Terms & Conditions
© 2026. The Author(s). Published by the American Astronomical Society.