Image Details
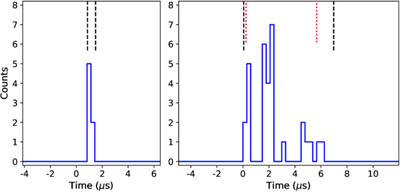
Caption: Figure 3.
Light curves of the microsecond-scale bursts with 0.3 μs time bins. The left panel shows the burst with a T90 of 0.6 μs, with the zero-point at 2018-11-22T11:58:14.425441 (TDB). The right panel shows the burst with a T90 of 5 μs, with the zero-point at 2022-07-24T23:59:07.273212 (TDB). The black vertical dashed lines indicate the Bayesian block boundaries, and the red dotted lines mark the calculated T90 intervals.
Other Images in This Article
Copyright and Terms & Conditions
© 2026. The Author(s). Published by the American Astronomical Society.
Copyright ©
2026 Astronomy Image Explorer. All Rights Reserved.