Image Details
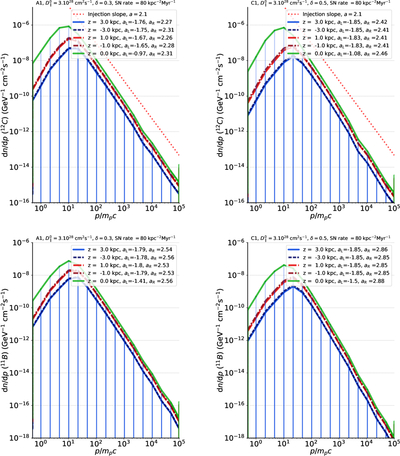
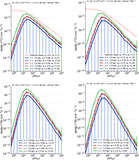
Caption: Figure 6.
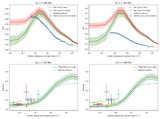
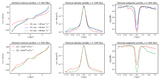
CR differential number density spectra dn/dp for the 12C (top) and 11B (bottom) isotopes in model A1 (left) and model C1 (right), after 500 Myr evolution, taken at five different altitude points in the box (with x = y = 0). The red dashed lines represent the initial slope a of the primary injection spectrum. For each spectrum, a fit slope estimation is given, with aL being the slope at nonrelativistic energy and aR being the slope at relativistic energy. The slopes differ in those energy ranges because of the different energy-dependent spallation, Coulomb energy loss, and diffusion processes.
Other Images in This Article
Show More
Copyright and Terms & Conditions
© 2026. The Author(s). Published by the American Astronomical Society.