Image Details
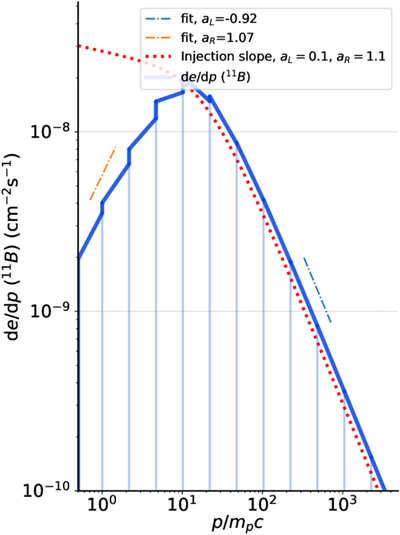
Caption: Figure 2.
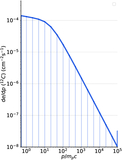
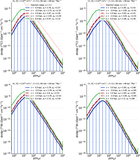
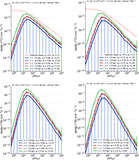
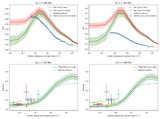
CR differential kinetic energy density spectrum for 12C after one step in a test simulation with primary 12C and secondary 11B only. The red curve is the primary injection spectrum of 12C (the amplitude is changed to compare both curves), as seen in Figure 1. We observe the differences between primaries and secondaries below p/mpc ≤ AC, showing how the momentum-dependent spallation rate changes the slope. A power-law fitting method applied to a few bins estimates the slope of the 11B spectrum (blue curve). The corresponding curves and slopes are displayed. As expected, the slopes of 11B and 12C differ by 1 for p/mpc ≤ AC and are equal for p/mpc ≥ AC.
Other Images in This Article
Show More
Copyright and Terms & Conditions
© 2026. The Author(s). Published by the American Astronomical Society.