Image Details
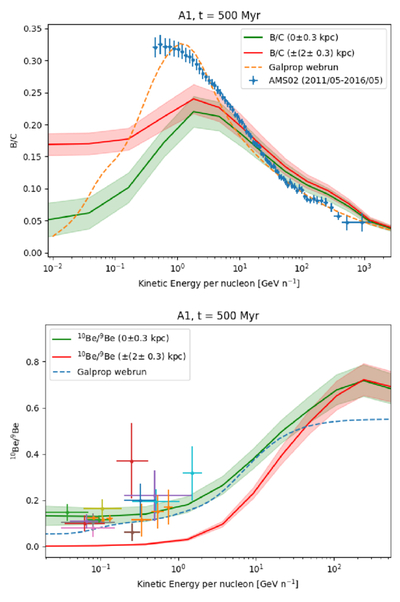
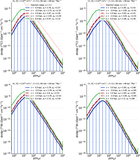
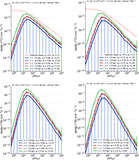
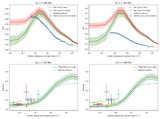
Caption: Figure 8.
Top: secondary-to-primary ratio B/C from the A1 run in Table 3 versus kinetic energy per nucleon, compared with the fiducial GALPROP WebRun simulation and AMS-02 experimental data. Bottom: unstable-to-stable isotope ratio 10Be/9Be from the same run versus kinetic energy per nucleon, also compared with the GALPROP WebRun model and with different experimental data extracted from the CRDB. The green curves are the mean points calculated in a 3D region of 0.625 kpc vertical size centered in the disk at z = 0, and the red curves are the mean points calculated in a 3D region of the same vertical size, far from the disk at ±2 kpc. The red and green colored bands are the respective standard deviations.
Other Images in This Article
Show More
Copyright and Terms & Conditions
© 2026. The Author(s). Published by the American Astronomical Society.