Image Details
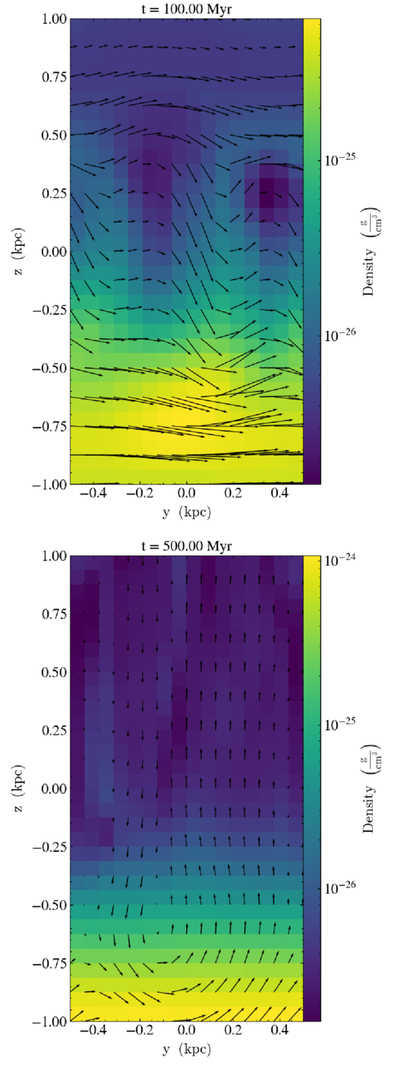
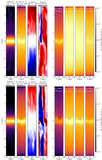
Caption: Figure 4.
Top: snapshot of the gas density within the section z ∈ [0, 2] kpc for run A1 at t = 100 Myr, where the magnetic field vectors are displayed. Bottom: the same snapshot as the top but at t = 500 Myr.
Other Images in This Article
Show More
Copyright and Terms & Conditions
© 2026. The Author(s). Published by the American Astronomical Society.
Copyright ©
2026 Astronomy Image Explorer. All Rights Reserved.