Image Details
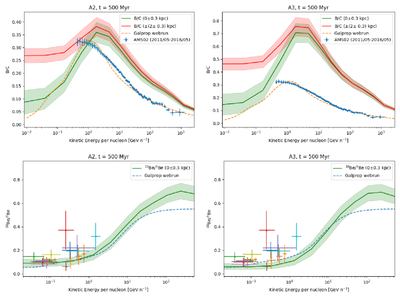
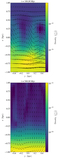
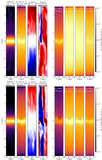
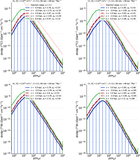
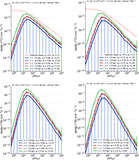
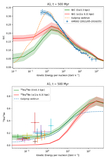
Caption: Figure 9.
The same B/C and 10Be/9Be plots as in the previous Figure 8, for the A2 and A3 models, only differing from the fiducial case by the SN rate. The left panels have an SN rate of 60 kpc−2 Myr−1, while the right panels have one of 20 kpc−2 Myr−1.
Other Images in This Article
Show More
Copyright and Terms & Conditions
© 2026. The Author(s). Published by the American Astronomical Society.
Copyright ©
2026 Astronomy Image Explorer. All Rights Reserved.