Image Details
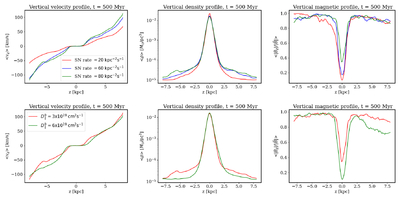
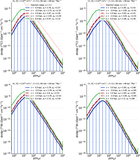
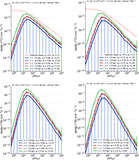
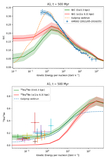
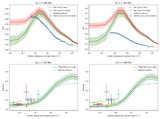
Caption: Figure 10.
Top: profiles of the vertical ISM gas velocity 〈vz〉 (left), gas density 〈ρ〉 (middle), and ﹩\langle |{B}_{z}|/|{\boldsymbol{B}}|\rangle ﹩ (right), averaged in the x–y plane versus altitude z in kiloparsecs for three runs with different SN rate values, displayed in the caption. Bottom: profiles of the vertical ISM gas velocity 〈vz〉 (left), gas density ρ (middle), and ﹩\langle |{B}_{z}|/|{\boldsymbol{B}}|\rangle ﹩ (right), averaged in the x–y plane versus altitude z in kiloparsecs for two runs with different diffusion coefficient ﹩{D}_{\parallel }^{0}﹩ values, displayed in the caption. The captions in the left panels apply to all the plots in the row.
Other Images in This Article
Show More
Copyright and Terms & Conditions
© 2026. The Author(s). Published by the American Astronomical Society.