

Image Details
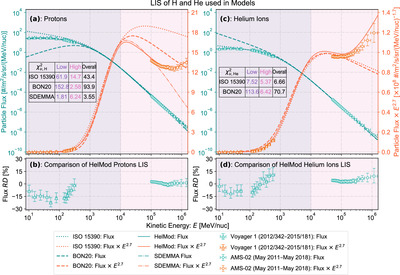
Caption: Figure 6.
The LIS used in the ISO 15390 (dotted lines), BON20 (dashed lines), HelMod (solid lines), and SDEMMA (dashed–dotted line, only for protons) models, as well as observed by Voyager 1 during 2012/342–2015/181 as reported in Cummings et al. (2016; triangular scattered points with error bars) and measured by AMS-02 from 2011 May to 2018 May with rigidities greater than 100 GV from Aguilar et al. (2021b; scattered circles with error bars) for two types of GCR particles: (a)/(b) protons and (c)/(d) helium ions. Panels (a) and (c) show the spectra, while (b) and (d) depict the relative difference of the LIS adopted in HelMod compared to the observational data of Voyager 1, where the error bars are the combinations of systematic and statistical errors. The CRÈME and DLR models adopt the ISO 15390 LIS, and the SDEMMA model adopts the same LIS as in HelMod except for protons. In panels (a) and (c), the dark cyan lines represent the particle flux aligned to the left y-axis, while the orange lines correspond to the particle flux multiplied by E 2.7 to the right; for the latter of which, pay attention to their magnitude is with a factor of 108. The purple and pink shaded areas cover the low-energy (101 ≤ E ≤ 104 MeV nuc−1) and high-energy (104 < E ≤ 106 MeV nuc−1) ranges, respectively. The corresponding ﹩{\chi }_{\nu }^{2}﹩ values for the various models in these two energy ranges, as well as the overall range, are listed in each panel in purple, pink, and black, respectively.
Other Images in This Article
Show More
Copyright and Terms & Conditions
© 2024. The Author(s). Published by the American Astronomical Society.

