

Image Details
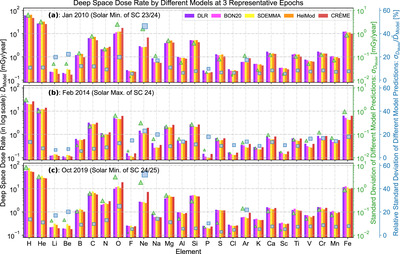
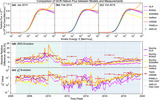
Caption: Figure 5.
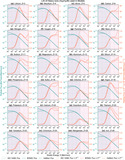
The deep space dose rate for elements with the atomic number ranging from 1 to 26 is computed by various GCR models at three representative epochs: (a) 2010 January for solar minimum between SC 23 and 24, (b) 2014 February for solar maximum of SC 24, and (c) 2019 October for solar minimum between SC 24 and 25. In each panel and for each element written in its abbreviation symbol, the deep space dose rate (D Model) calculated by the DLR, BON20, SDEMMA, HelMod, and CRÈME models is denoted by purple, magenta, yellow, orange, and red bars, respectively. Note that the dose rate is plotted in log scale because of the large-scale differences. The standard deviation (﹩{\sigma }_{{D}_{\mathrm{Model}}}﹩) of different model predictions is depicted as green triangles, and the relative standard deviation, defined as the standard deviation divided by the mean value of the five model outputs (﹩{\sigma }_{{D}_{\mathrm{Model}}}/{\bar{D}}_{\mathrm{Model}}﹩), is plotted as blue squares. The size of the scattered points is positively correlated with the value.
Other Images in This Article
Show More
Copyright and Terms & Conditions
© 2024. The Author(s). Published by the American Astronomical Society.

