

Image Details
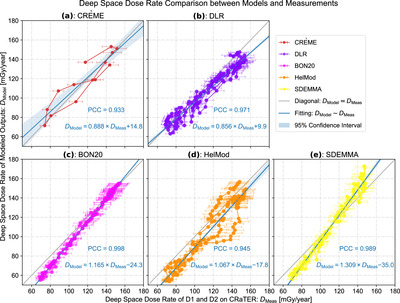
Caption: Figure 4.
Comparison of the modeled (D Model, on the y-axes) and measured (D Meas, on the x-axes) deep space dose rate for (a) CRÈME, in red; (b) DLR, in purple; (c) BON20, in magenta; (d) HelMod, in orange; (e) SDEMMA, in yellow. In each panel, the dose rate output from the model has been correlated with the D1 and D2 measurements on CRaTER during the time when both data are available: from 2009 to 2022 for CRÈME, DLR, BON20, and HelMod, and to 2019 for SDEMMA. The data points in each panel are connected following the time evolution, with horizontal error bars for the factor of f ↑ ∈ [0.086, 0.199], corresponding to the error bars in CRaTER measurements in Figure 3(b). For each model, their outputs are linearly fitted to the measurements by the blue line, and the 95% confidence is shown in the shaded blue area. The Pearson correlation coefficient (Pearson 1895) and the fitting formula are shown in each panel, also with a gray line in diagonal denoting D Model = D Meas as a reference.
Other Images in This Article
Show More
Copyright and Terms & Conditions
© 2024. The Author(s). Published by the American Astronomical Society.

