

Image Details
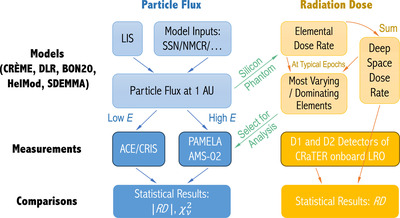
Caption: Figure 2.
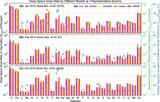
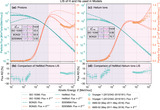
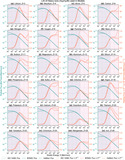
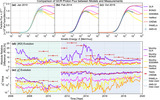
Flowchart of this work: Five GCR Models are investigated (Section 2.1), each of which takes the LIS and/or SSN, NMCR as input parameters and provides the particle flux in deep space at 1 au. For each model, a silicon phantom is then applied to simulate the corresponding deep space dose rate, and the predictions are compared to measurements by the D1 and D2 detectors of CRaTER in Section 3, giving the relative difference (RD). With the examination of the elemental contribution to the absorbed dose at three typical epochs, the simulation also implies the most varying or dominating species, whose particle flux is then analyzed by comparing with the ACE/CRIS data at low energies, as well as the PAMELA and AMS-02 data at high energies in Section 4. The corresponding absolute relative difference (﹩\left|{RD}\right|﹩) and reduced chi-squared value (﹩{\chi }_{\nu }^{2}﹩) are given via the statistical analysis.
Other Images in This Article
Show More
Copyright and Terms & Conditions
© 2024. The Author(s). Published by the American Astronomical Society.

