

Image Details
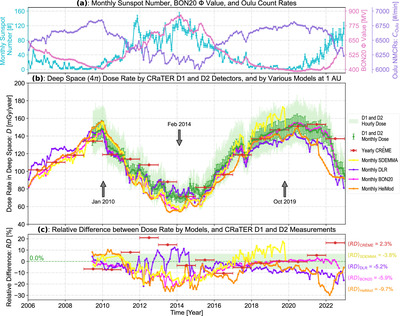
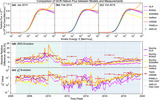
Caption: Figure 3.
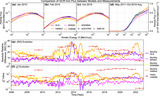
The deep space dose rate calculated by various models and observed by the CRaTER D1 and D2 detectors. (a) Inputs of these GCR models: monthly sunspot number from the SILSO World Data Center (2006–2022) used in the BON20, HelMod, and SDEMMA models (in cyan), with error bars indicating deviations among multiple observations within a given month, the solar modulation potential Φ in the BON20 model (in pink), and the Oulu NMCRs employed in the DLR model (C Oulu, in purple). (b) Absorbed dose rate in deep space (D), with a solid angle of 4π sr, derived from the CRaTER D1 and D2 measurements (with SEP events removed) using Equation (18) and simulated by models: light-green shaded area represents the hourly dose rate, while the green line is for the monthly averaged dose rate, accompanied by an error bar indicating the contribution of secondary lunar albedo particles radiation (f ↑) ranging from 8.6% to 19.9%. The green dots in between are derived when considering the albedo ratio as the median value, 14.25%. The yellow, purple, magenta, and orange lines correspond to the monthly dose rate computed by the SDEMMA, DLR, BON20, and HelMod models, respectively. The red scattered points with an error bar for 1 yr time span are the yearly dose rate computed by the CRÈME model. Three arrows are included to indicate the selected epochs for subsequent analysis. (c) Relative difference between the dose rate calculated by models and measured by the CRaTER D1 and D2 detectors. A green dotted line represents no error compared to the green dots in panel (b), with a light-green shaded area (∼±6%) for the variation of f ↑ ∈ [0.086, 0.199]. The legend from panel (b) remains the same here. The corresponding mean value of the relative difference over the entire span for each model is marked on the right side.
Other Images in This Article
Show More
Copyright and Terms & Conditions
© 2024. The Author(s). Published by the American Astronomical Society.

