

Image Details
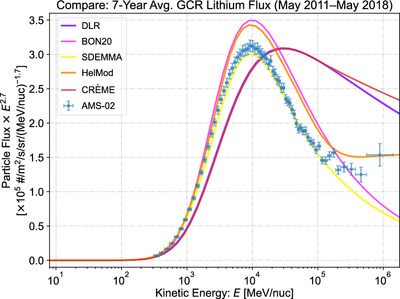
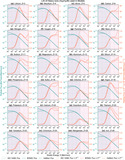
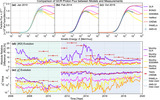
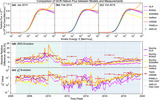
Caption: Figure 16.
Comparison of the GCR lithium flux between AMS-02 measurements (blue scattered points with systematic errors) and models: the purple, magenta, yellow, orange, and red curves denote the lithium flux multiplied by E 2.7 in DLR, BON20, SDEMMA, HelMod, and CRÈME, respectively.
Other Images in This Article
Show More
Copyright and Terms & Conditions
© 2024. The Author(s). Published by the American Astronomical Society.

Copyright ©
2026 Astronomy Image Explorer. All Rights Reserved.
