Image Details
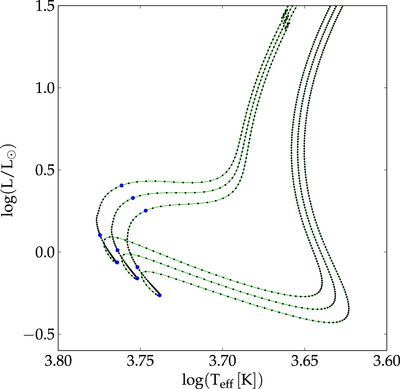
Caption: Figure 8.
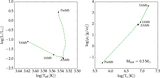
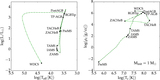
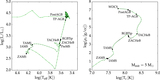
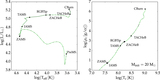
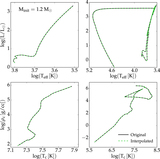
This figure shows how the primary and secondary EEPs are distributed along three stellar evolution tracks with Minit = 0.95, 1, and 1.05 M⊙. The original tracks are plotted as solid lines; the secondary EEPs are shown as small dots and the primary EEPs are shown as large dots. This should give some indication that the EEP-based tracks constitute a uniform basis.
Other Images in This Article
Show More
Copyright and Terms & Conditions
© 2016. The American Astronomical Society. All rights reserved.
Copyright ©
2026 Astronomy Image Explorer. All Rights Reserved.