Image Details
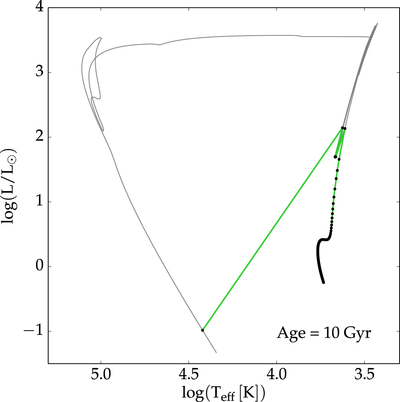
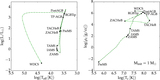
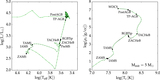
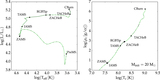
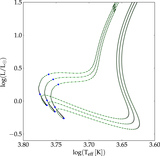
Caption: Figure 2.
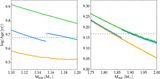
Filled circles show the points at which a grid of stellar evolution tracks reach 10 Gyr. The difference in Minit between each successive point is 0.001 M⊙. The green line shows the simple approach to isochrone construction in which a given age is located in each track and then these points are connected by line segments. The gray line shows an isochrone made using the sophisticated approach described in this paper.
Other Images in This Article
Show More
Copyright and Terms & Conditions
© 2016. The American Astronomical Society. All rights reserved.
Copyright ©
2026 Astronomy Image Explorer. All Rights Reserved.