Image Details
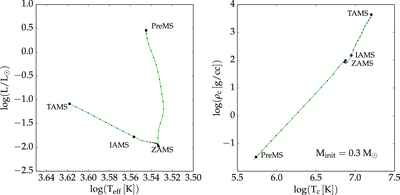
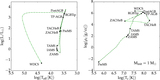
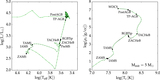
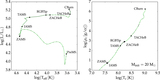
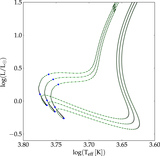
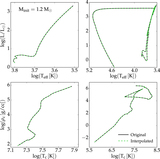
Caption: Figure 4.
A 0.3 M⊙ stellar evolution track in the H–R diagram (right) and the Tc–ρcdiagram (left). The original track is shown as the solid line. The primary EEPs described in Section 2.1 are labeled and marked by large dots; secondary EEPs described in Section 2.2 are shown as small dots along the track.
Other Images in This Article
Show More
Copyright and Terms & Conditions
© 2016. The American Astronomical Society. All rights reserved.
Copyright ©
2026 Astronomy Image Explorer. All Rights Reserved.