Image Details
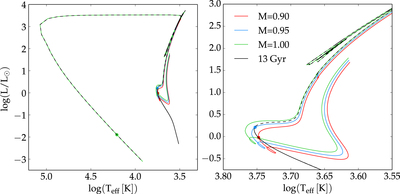
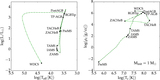
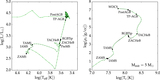
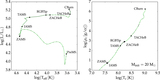
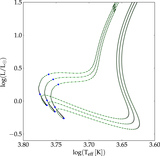
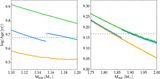
Caption: Figure 3.
13 Gyr isochrone and three stellar evolution tracks with Minit = 0.90, 0.95, 1.00 M⊙. The left panel shows the entire span of a 13 Gyr isochrone (black) and the 1 M⊙ track (green). The 0.90 (red) and 0.95 M⊙ (blue) tracks are only plotted from the pre-main sequence to the end of the RGB phase for clarity. The right panel focuses on the main sequence, subgiant branch, and red giant branch. The isochrone is plotted as a solid line for all points that satisfy Minit < 0.95 M⊙ and as a dashed line elsewhere. Finally, the point at which each track has an age of 13 Gyr is shown as a filled circle; for the 1 M⊙ track, this point is only visible in the left panel.
Other Images in This Article
Show More
Copyright and Terms & Conditions
© 2016. The American Astronomical Society. All rights reserved.