Image Details
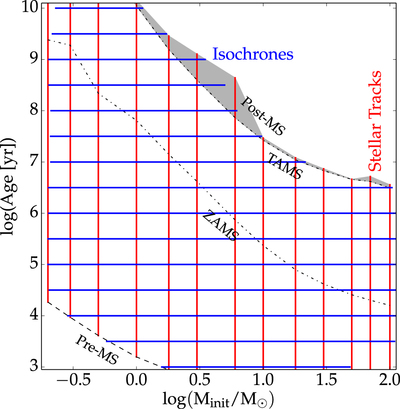
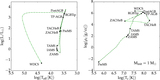
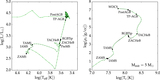
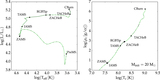
Caption: Figure 1.
Schematic view of stellar evolution tracks and isochrones in the Minit-age plane. The diagonal lines and corresponding labels mark the positions of evolutionary phases up to and including the main sequence. The gray shaded region shows all post-main-sequence evolution.
Other Images in This Article
Show More
Copyright and Terms & Conditions
© 2016. The American Astronomical Society. All rights reserved.
Copyright ©
2026 Astronomy Image Explorer. All Rights Reserved.