

Image Details
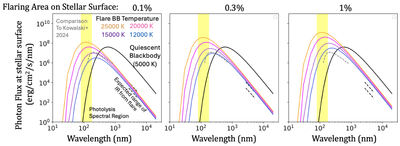
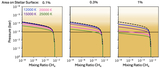
Caption: Figure 4.
Construction of the flare spectral energy distributions used in this work. We parameterize the stellar spectrum during a flare as the sum of the quiescent blackbody spectrum (5000 K emitted by the entire star) and the flaring spectrum, which we model with its own effective temperature and physical size (fraction of stellar surface area). Blackbody spectra of the quiescent star (5000 K, black) and the flare at effective temperatures of 12,000 K (blue), 15,000 K (purple), 20,000 K (pink), and 25,000 K (orange). The different panels describe different assumed areas of the flaring region on the star's surface, increasing from 1% (left) to 3% (middle) and 10% (right). The yellow shaded region shows the spectral region relevant to photolysis. The dashed black lines show the expected contribution of the stellar flare to the IR flux according to the JWST measurement of V1298 Tau (S. Barat et al. 2025). We compare (dashed gray line) to TESS measurements of M stars to demonstrate that the energies of our flares agree in our 0.1% area cases (A. F. Kowalski et al. 2024); in cases with larger flares, our model exceeds those measured energies. Measurements of K stars (hotter and more massive than M stars) are limited, and flares are stochastic by nature; so energetic flares may be plausible too. During a flare, the spectrum is modeled as the sum of the flare and the quiescent spectra shown here.
Other Images in This Article
Show More
Copyright and Terms & Conditions
© 2026. The Author(s). Published by the American Astronomical Society.

