

Image Details
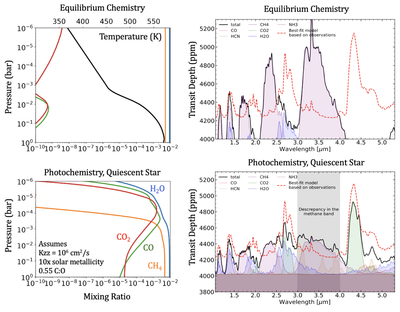
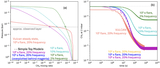
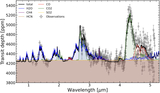
Caption: Figure 2.
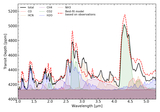
Atmospheric mixing ratio profiles and their corresponding synthetic spectra for V1298 Tau b under standard equilibrium chemistry and photochemistry. (top left) Equilibrium chemistry (no photochemistry) profiles for H2O (blue), CH4 (orange), CO (green), and CO2 (red) at a temperature-pressure profile with Tint = 100 K. (top right) Corresponding synthetic spectrum for the model at chemical equilibrium shown on the left. The modeled transit spectrum is shown in black with the contributions from single molecules shown as the colored regions. The dashed red curve shows the best-fitting transit spectrum to the JWST and HST observations. (bottom left) Mixing ratio profiles from VULCAN (with photochemistry) for a quiescent star. This model assumes Kzz = 106 cm2 s−1 with an atmosphere of 10× solar metallicity and a C:O ratio of 0.55 (i.e., solar). (bottom right) Same as in the top right, but with photochemistry. Both models overpredict the CH4 abundance near the observing layer (approximately 2 mbar). As a result, both spectra show large CH4 absorption bands, mainly at 3.3 μm, which are inconsistent with the data.
Other Images in This Article
Show More
Copyright and Terms & Conditions
© 2026. The Author(s). Published by the American Astronomical Society.

