

Image Details
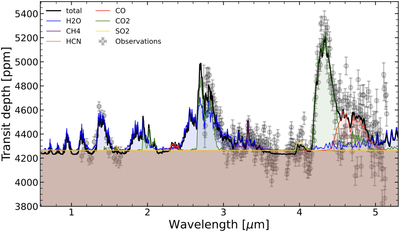
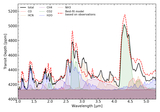
Caption: Figure A3.
Transmission spectrum of V1298 Tau b observed with HST/WFC3 and JWST/NIRSpec G395H. The transit spectrum of V1298 Tau b is shown as gray data points with 1σ error bars for the HST/WFC3 transit (S. Barat et al. 2024) and the JWST/NIRSpec G395H transit (S. Barat et al. 2025). The simulated transmission spectrum of the best-fit model retrieved with SCARLET is shown in black, with the molecular contributions shown as the colored regions. The brown area represents the cloud deck opacity contribution. Water, carbon dioxide, and carbon monoxide show clear absorption bands. The observations only show a shallow methane absorption band around the Q-branch (at 3.3 μm).
Other Images in This Article
Show More
Copyright and Terms & Conditions
© 2026. The Author(s). Published by the American Astronomical Society.

