

Image Details
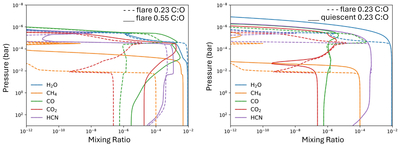
Caption: Figure A4.
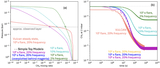
Species mixing ratio profiles for C:O of 0.23 (dashed) and 0.55 (solid) are compared on the left, both after a flare of 1e5 s. (A long flare was intentionally chosen to estimate what may happen after many repeated flares). All carbon species deplete too much in the C:O = 0.23 case compared to the observations. The right panel shows the C:O = 0.23 during the quiescent period also underestimates all carbon species, making this case also a poor match to the data.
Other Images in This Article
Show More
Copyright and Terms & Conditions
© 2026. The Author(s). Published by the American Astronomical Society.

Copyright ©
2026 Astronomy Image Explorer. All Rights Reserved.
