

Image Details
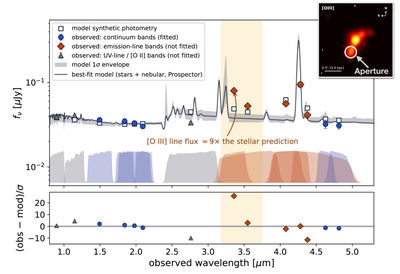
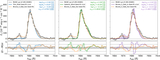
Caption: Figure 8.
Continuum SED fit to the southeastern clump. Top: The dark curve and gray band show the best-fit Prospector model and the 1σ posterior range. Only the six line-free bands (blue circles) are used in the fit; the remaining bands contain strong emission lines and are shown for comparison. Open squares show the corresponding model photometry. Bottom: residuals between the observed and model photometry. F335M, which contains [O III], shows a strong excess, corresponding to an observed [O III] flux approximately 9 times higher than the median stellar-photoionization prediction.
Other Images in This Article
Copyright and Terms & Conditions
© 2026. The Author(s). Published by the American Astronomical Society.

Copyright ©
2026 Astronomy Image Explorer. All Rights Reserved.
