

Image Details
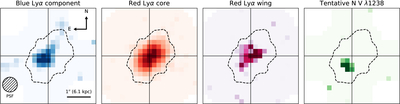
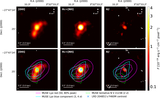
Caption: Figure 4.
MUSE narrowband maps of the multicomponent Lyα emission and the tentative N V λ1238 detection in LRD-204851. From left to right: the blue Lyα component, the red Lyα core, the red Lyα wing, and the N V λ1238 narrowband map. Per-panel color stretches saturate at the 99.5th percentile and use a lower limit of 1σ for the displayed map, so structures below the noise level fade to white. The black dashed contour shows the boundary of the Lyα segmentation map from the MUSE HUDF release and is identical in every panel; the thin black crosshairs mark the NIRCam/F460M continuum centroid.
Other Images in This Article
Copyright and Terms & Conditions
© 2026. The Author(s). Published by the American Astronomical Society.

Copyright ©
2026 Astronomy Image Explorer. All Rights Reserved.
