

Image Details
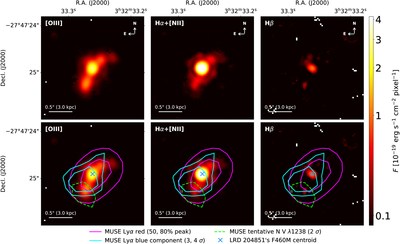
Caption: Figure 5.
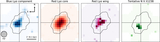
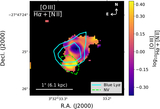
Optical emission-line maps of LRD-204851 constructed using NIRCam imaging. From left to right: [O III], Hα+[N II], and Hβ. The top row shows the maps alone; the bottom row overlays the MUSE red (magenta) and blue (cyan) Lyα component contours and the tentative N V λ1238 contour (green dashed), with the NIRCam/F460M continuum centroid marked by the blue ×. All panels share a common color scale of line flux per pixel.
Other Images in This Article
Copyright and Terms & Conditions
© 2026. The Author(s). Published by the American Astronomical Society.

Copyright ©
2026 Astronomy Image Explorer. All Rights Reserved.
