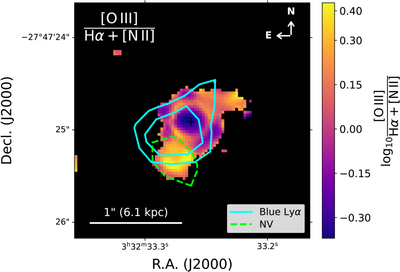
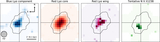
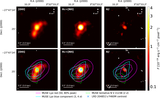
Map of the line ratio ﹩{\mathrm{log}}_{10}﹩([O III]/Hα + [N II]) in LRD-204851, derived from the line maps shown in Figure 5. Pixels are masked where either line has S/N < 3. Overlaid contours show the MUSE blue Lyα component and the tentative N V λ1238 emission, as in Figure 5.