

Image Details
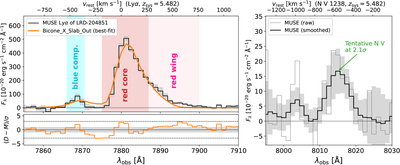
Caption: Figure 2.
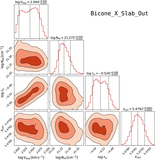
Left: MUSE spectrum (black) of the Lyα region with the Bicone_X_Slab_Out best-fit model (orange) overlaid. The cyan, red, and pink bands mark the disjoint windows used to build the blue-component, red-core, and red-wing narrowband maps (see Section 3.3). The lower subpanel shows the fit residuals with ±1σ (gray band) and ±3σ (dashed) reference levels. The full posterior is shown in Appendix B. Right: MUSE spectrum around N V λ1238, with the raw flux (light gray) overlaid by a 1.5-pixel (i.e., ≈1.8 Å) Gaussian-smoothed version (black) and its propagated ±1σ band. The arrow marks the tentative 2.1σ N V λ1238 detection.
Other Images in This Article
Copyright and Terms & Conditions
© 2026. The Author(s). Published by the American Astronomical Society.

