

Image Details
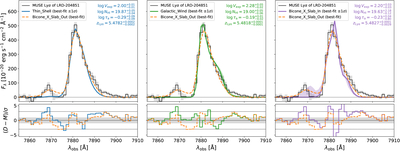
Caption: Figure B2.
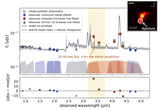
Best-fit zELDA Lyα profiles for the three alternative gas geometries, overlaid on the observed MUSE Lyα spectrum (black, with 1σ shading). The Bicone_X_Slab_Out model is shown in all panels as a red dashed line for comparison. The bottom panels show the residuals, demonstrating that Bicone_X_Slab_Out outperforms the other three geometries.
Other Images in This Article
Copyright and Terms & Conditions
© 2026. The Author(s). Published by the American Astronomical Society.

Copyright ©
2026 Astronomy Image Explorer. All Rights Reserved.
