

Image Details
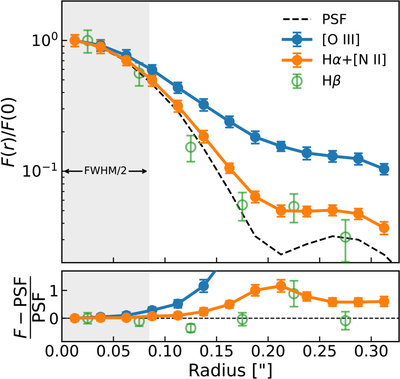
Caption: Figure 6.
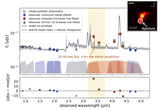
Azimuthally averaged radial surface-brightness profiles of the optical emission-line maps in LRD-204851 (Figure 5), normalized by the central-annulus value. The black dashed curve shows the radial profile of the PSF, and the gray shaded region marks the scale of the PSF’s FWHM/2. The bottom panel shows the relative difference from the PSF. The Hα+[N II] profile tracks the PSF within r ≲ 0﹩\mathop{.}\limits^{{\unicode{x02033}}}﹩15, while the [O III] profile lies above the PSF, indicating a more extended light distribution than Hα+[N II].
Other Images in This Article
Copyright and Terms & Conditions
© 2026. The Author(s). Published by the American Astronomical Society.

Copyright ©
2026 Astronomy Image Explorer. All Rights Reserved.
