

Image Details
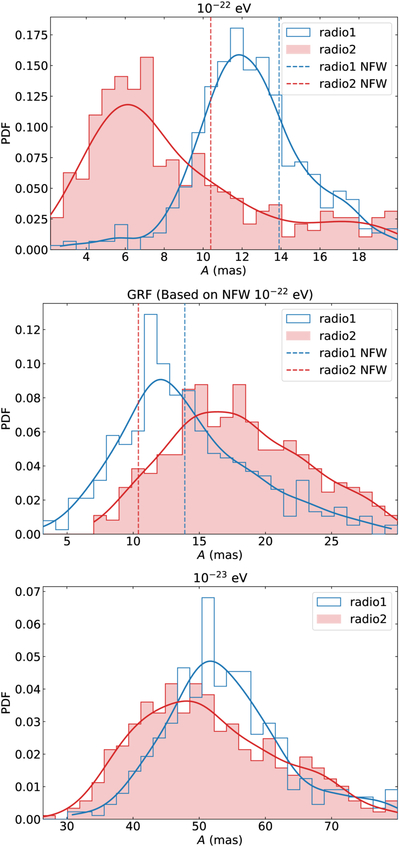
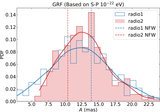
Caption: Figure 3.
Probability distributions of the image-position anomaly A. (a) S–P FDM simulations with mψ = 10−22 eV. (b) GRF-based FDM density realizations constructed on top of the best-fitting NFW model. (c) S–P FDM simulations with mψ = 10−23 eV. The blue and red histograms show the normalized distributions for the two radio sources, radio1 and radio2, respectively, while the solid curves denote the corresponding kernel-density-estimation (KDE) fits. The blue and red vertical dashed lines indicate the position anomalies predicted by the best-fitting smooth NFW model for radio1 and radio2, respectively.
Other Images in This Article
Copyright and Terms & Conditions
© 2026. The Author(s). Published by the American Astronomical Society.

Copyright ©
2026 Astronomy Image Explorer. All Rights Reserved.
