

Image Details
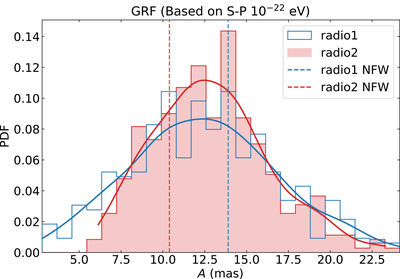
Caption: Figure A5.
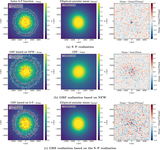
Extension of Figure 3; see Section A.5 for further discussion. Probability distributions of the image-position anomaly A for GRF-based FDM realizations constructed using the selected S–P density field with mψ = 10−22 eV. The blue and red histograms show the normalized distributions for radio1 and radio2, respectively, while the solid curves denote the corresponding KDE fits. The blue and red vertical dashed lines indicate the position anomalies predicted by the best-fitting smooth NFW model for radio1 and radio2, respectively.
Other Images in This Article
Copyright and Terms & Conditions
© 2026. The Author(s). Published by the American Astronomical Society.

Copyright ©
2026 Astronomy Image Explorer. All Rights Reserved.
