

Image Details
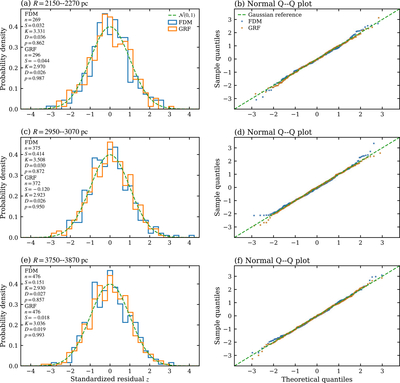
Caption: Figure A3.
Gaussianity tests for the standardized residual fluctuations in three representative annuli. To match the adopted de Broglie wavelength, λdB ∼ 120 pc, each annulus is assigned a radial width of ΔR = 120 pc. For each annulus, the left panel compares the probability density distributions of the standardized residuals from the FDM and GRF realizations with the standard normal distribution, ﹩{ \mathcal N }(0,1)﹩, while the right panel shows the corresponding normal Q–Q plot. The reported statistics are the sample size n, skewness S, kurtosis K, K-S statistic D, and its associated p-value. The S–P FDM residuals are broadly consistent with Gaussian statistics within the selected annuli and exhibit good agreement with the GRF realization. See Section A.3 for further discussion.
Other Images in This Article
Copyright and Terms & Conditions
© 2026. The Author(s). Published by the American Astronomical Society.

