

Image Details
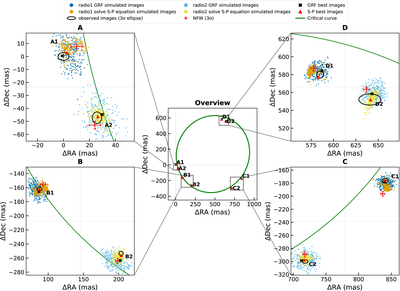
Caption: Figure 4.
Predicted and observed lensed image positions for the two radio components of HS 0810+2554. The central panel shows the full image configuration, while the surrounding panels zoom into the individual images. To avoid visual overcrowding, only the 300 best-matching realizations with the smallest position anomaly A are shown, with the images denoted by colored points. The black solid ellipses denote the 3σ measurement uncertainties of the image positions. The NFW-predicted image positions and their corresponding 3σ uncertainties obtained from MCMC simulations, adopted from J. Liu et al. (2024), are shown as red + symbols. The black × symbols denote the best-matching GRF image positions, while the red ▴ symbols denote the best-matching S–P simulated image positions. The green curve denotes the critical curve of the best-fitting elliptical NFW model for HS 0810+2554.
Other Images in This Article
Copyright and Terms & Conditions
© 2026. The Author(s). Published by the American Astronomical Society.

