

Image Details
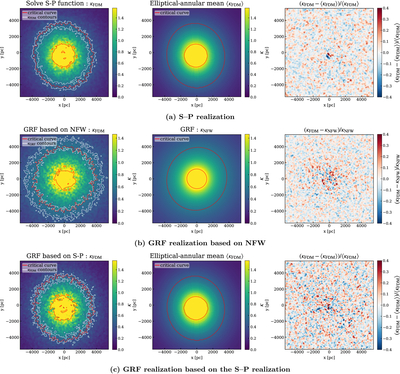
Caption: Figure A4.
Extension of Figure 1; see Sections A.4 and A.5 for further discussion. Panel set (a) shows the mψ = 10−22 eV S–P realization: the projected convergence field κFDM, its elliptical-annular mean 〈κFDM〉, and the corresponding fractional residual (κFDM − 〈κFDM〉)/〈κFDM〉. Panel set (b) shows the conventional GRF realization based on the NFW model for λdB ∼ 120 pc: the total convergence field κFDM, the smooth NFW reference field κNFW, and the fractional residual (κFDM − κNFW)/κNFW. Panel set (c) shows a GRF realization constructed from the S–P result, for which the elliptical-annular mean of the selected S–P convergence map defines the smooth component and the spatially varying fluctuation amplitude is derived from the corresponding three-dimensional S–P density field. The three columns show the resulting total convergence field κFDM, its S–P-derived elliptical-annular mean 〈κFDM〉, and the corresponding fractional residual (κFDM − 〈κFDM〉)/〈κFDM〉, respectively. The white contours correspond to κFDM ∼ 0.45 and 0.60, respectively, and highlight the density fluctuations around the critical curve, which is shown in red. For visualization, each convergence map is capped at its 95th-percentile value, with all values above this threshold assigned the threshold value. Across all three panel sets, the fractional-residual maps are displayed using a common symmetric color scale whose limits are set by the smallest of their individual maximum absolute displayed values, thereby facilitating direct comparison.
Other Images in This Article
Copyright and Terms & Conditions
© 2026. The Author(s). Published by the American Astronomical Society.

