

Image Details
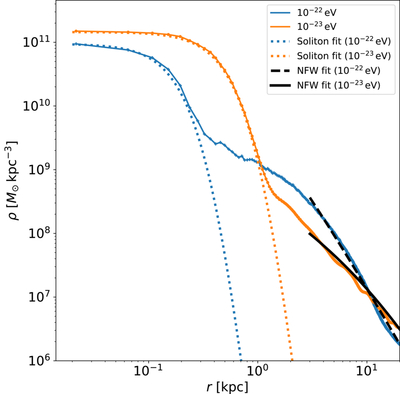
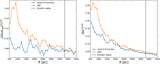
Caption: Figure 2.
Spherically averaged radial-density profiles of the evolved FDM halos. The blue and orange curves correspond to particle masses of mψ = 10−22 eV and mψ = 10−23 eV, respectively. The blue and orange dotted curves show the corresponding best-fitting soliton profiles in the inner halo regions (H.-Y. Schive et al. 2014b). The black dashed and solid curves show the best-fitting NFW profiles for the mψ = 10−22 eV and mψ = 10−23 eV halos, respectively, obtained using only the radial data beyond the effective Einstein radius.
Other Images in This Article
Copyright and Terms & Conditions
© 2026. The Author(s). Published by the American Astronomical Society.

Copyright ©
2026 Astronomy Image Explorer. All Rights Reserved.
