

Image Details
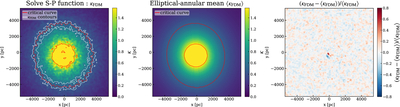
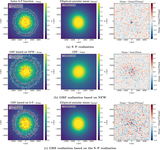
Caption: Figure 1.
Projected density field of an evolved FDM halo obtained from the S–P simulation (mψ = 10−22 eV). From left to right, the panels show the convergence κFDM (projected surface mass density relative to the critical density), its elliptical-annular mean 〈κFDM〉, and the relative residual between the total and mean convergence (κFDM − 〈κFDM〉)/〈κFDM〉. The ellipticity and position angle of the annuli are inferred from the projected convergence distribution. The white contours correspond to κFDM ∼ 0.45 and 0.60, respectively, and highlight the density fluctuations around the critical curve, which is shown in red. For visualization, all maps are clipped at their respective 95th-percentile values. See Section A.4 for further discussion.
Other Images in This Article
Copyright and Terms & Conditions
© 2026. The Author(s). Published by the American Astronomical Society.

