

Image Details
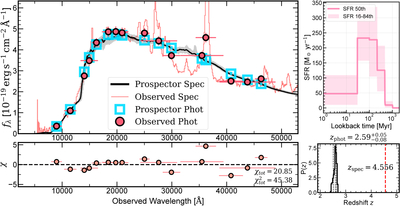
Caption: Figure A2.
Photometric redshift and SED modeling on the JWST photometry for UDS-27023 using the Prospector code, still revealing a quiescent/post-starburst galaxy at zphot ≈ 2.6. Left: observed spectrum (thin red line) and photometry (filled red circles with error bars) compared with the best-fit Prospector model spectrum (thick black line) and synthetic photometry (open cyan squares). Fit residuals χ are shown in the lower panel, with total χ2 values for the fit indicated. Top right: posterior SFR as a function of lookback time. Bottom right: photometric redshift probability distribution P(z). The spectroscopic redshift zspec = 4.556 is marked by the vertical red dashed line.
Other Images in This Article
Copyright and Terms & Conditions
© 2026. The Author(s). Published by the American Astronomical Society.

