

Image Details
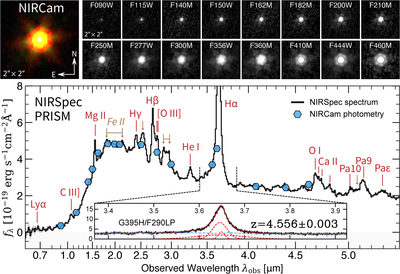
Caption: Figure 1.
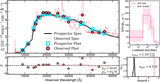
JWST imaging and spectroscopy of UDS-27023. Top: 2″ × 2″ JWST/NIRCam cutouts in the available filters and an RGB composite (left), showing that the source is compact and dominated by a point source in all bands. Bottom: JWST/NIRSpec PRISM spectrum (black) overlaid with the NIRCam photometry (blue hexagons), illustrating the bright continuum and strong broad emission lines characteristic of a Type I QSO. The spectrum shows a strongly suppressed rest-frame UV continuum relative to the rest-frame optical emission, suggesting an exceptionally steep extinction curve. Inset: Zoom-in on the G395H/F290LP spectrum around Hα, together with a multicomponent fit (solid red; dashed components). The spectroscopic redshift of UDS-27023 is measured to be z = 4.556 ± 0.003.
Other Images in This Article
Copyright and Terms & Conditions
© 2026. The Author(s). Published by the American Astronomical Society.

