

Image Details
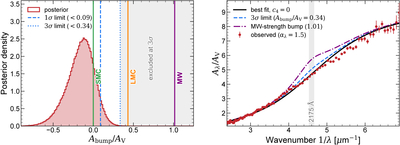
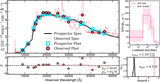
Caption: Figure B1.
Constraints on the 2175 Å bump toward UDS-27023. Left: posterior distribution of the bump strength Abump/AV from the fit with c4 free, marginalized over the intrinsic-slope grid. Blue dashed and dotted lines mark the 1σ and 3σ upper limits obtained with the physical prior c4 ≥ 0; the gray band indicates the region excluded at 3σ. Vertical colored lines show the Milky Way and LMC values from the Drude fits of A. Li et al. (2008); the SMC is bumpless in the same formalism and so coincides with zero. Right: observed extinction curve in the vicinity of the bump (red points, for αλ = 1.5) compared with the best-fit bump-free model (black), the same model with a bump at our 3σ upper limit (blue dashed), and with a Milky Way–strength bump (purple dotted–dashed). The gray band marks the rest-frame position of the feature. A Milky Way–like bump is clearly inconsistent with the data.
Other Images in This Article
Copyright and Terms & Conditions
© 2026. The Author(s). Published by the American Astronomical Society.

