

Image Details
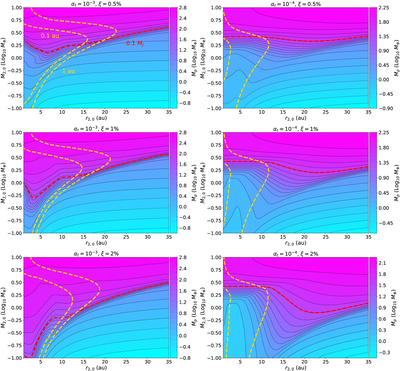
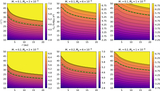
Caption: Figure B1.
Contour plots of final planetary mass as a function of initial mass and initial orbital radius under different turbulent viscosity and pebble-to-gas ratios during the second accretion phase. Using the case of a 0.2 M⊙ M dwarf in Figure 3 as an example, rows correspond to pebble-to-gas ratios of 0.5%, 1%, and 2%, while columns represent turbulent diffusion coefficient values of 10−3 and 10−4. The red dashed lines denote the 0.1 MJ contours, and the yellow dashed lines indicate the 1 au orbital radius contours. The initial orbital radius and initial mass are not physically correlated due to the omission of the first accretion phase. The simulation aims to demonstrate that terrestrial planets around M dwarfs can evolve into giant planets under various parameter configurations.
Other Images in This Article
Copyright and Terms & Conditions
© 2026. The Author(s). Published by the American Astronomical Society.

