

Image Details
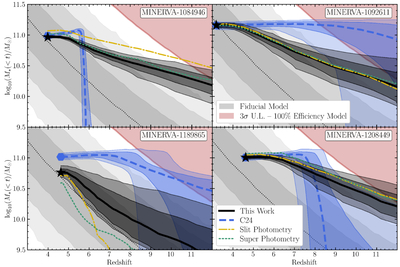
Caption: Figure 5.
Stellar mass assembly histories of the four ultramassive quiescent galaxies based on our fiducial PROSPECTOR model. The sum of the median stellar mass assembly histories (defined as the cumulative sum of the mass of living stars and stellar remnants) for each of the annuli is shown with thick black lines. 1σ and 2σ uncertainties are determined by a quadrature sum of the uncertainties on the assembly histories of the seven individual annuli and are indicated by black shading. Median stellar mass assembly histories of the slit photometry are shown as the green dashed line, and median histories using the super+MIRI photometry used to inform our strong dust prior are shown as the gold dashed–dotted line (see Appendices B and D). Slit and super+MIRI assembly histories are decreased by a constant factor of 1.12 (see note in Table 2). Dashed curves show the stellar mass assembly histories from C24, with 1σ and 2σ confidence intervals shaded. MINERVA-1084946 only shows 1σ uncertainties as the 2σ intervals are not shown in C24. The 1σ, 2σ, and 3σ regions of the C. C. Lovell et al. (2022) EVS-based stellar mass limits are shown as a function of redshift for the C. C. Lovell et al. (2022) fiducial model (determined with dark matter halo efficiencies drawn from a truncated log-normal distribution where μ = e−2 and σ = 1, i.e., 0.050 < f⋆ < 0.368) as the gray contours. Stellar masses which would exceed the upper 3σ limit determined by the C. C. Lovell et al. (2022) model with 100% halo efficiency are denoted by the shaded red region. The specific EVS models shown here also assume an on-sky area of 160 arcmin2, to match the selection function and analysis used in C24. Our PROSPECTOR modeling of resolved photometry finds much less tension with the fiducial EVS model when compared to the C24 assembly histories.
Other Images in This Article
Copyright and Terms & Conditions
© 2026. The Author(s). Published by the American Astronomical Society.

